
Debugger
Porta speaks the Debug Adapter Protocol over a child process's stdio, so any DAP adapter works — configuration is per language, no code required.
Configuring an adapter
Either in Settings → your language ("Debug adapter" + "Launch config (JSON)") or directly in .porta.json:
{
    "languages": {
        "php": {
            "debug": {
                "adapter": "node /path/to/vscode-php-debug/out/phpDebug.js",
                "launch": {"port": 9003}
            }
        }
    }
}adapter— the command that starts the DAP adapter (string or argv list).launch— a JSON object merged into the DAPlaunchrequest on top of the defaults:program = ${file},cwd = ${workspaceRoot},stopOnEntry = false. The placeholders${file}and${workspaceRoot}are substituted anywhere in your overrides.
Changes apply to the next debug session. For PHP, the vscode-php-debug adapter with Xdebug is a good fit.
A session
| Key | Action |
|---|---|
Shift+F9 | Start debugging the current file |
Ctrl+F8 (or click the gutter) | Toggle a breakpoint on the caret's line |
Ctrl+Shift+F8 | Edit the caret line's breakpoint condition |
Ctrl+Shift+F9 | Add a watch expression |
Alt+F9 | Run to cursor (paused only) |
F8 | Step over |
F7 | Step into |
Shift+F8 | Step out |
F9 | Resume |
Ctrl+F2 | Stop |
Breakpoints render as gutter dots (●, or ◆ when conditional) and survive buffer switches. Ctrl+Shift+F8 prompts for a condition and a hit count (leave both empty to make the breakpoint unconditional again; using it on a bare line creates the breakpoint). Conditions are passed through to the adapter verbatim — if it doesn't advertise support, they're stripped with a warning in the debug output. The step/resume/stop keys only capture input while a session runs (paused for stepping) — otherwise they keep their editor meanings (F7/Shift+F7 conflict navigation, etc.).
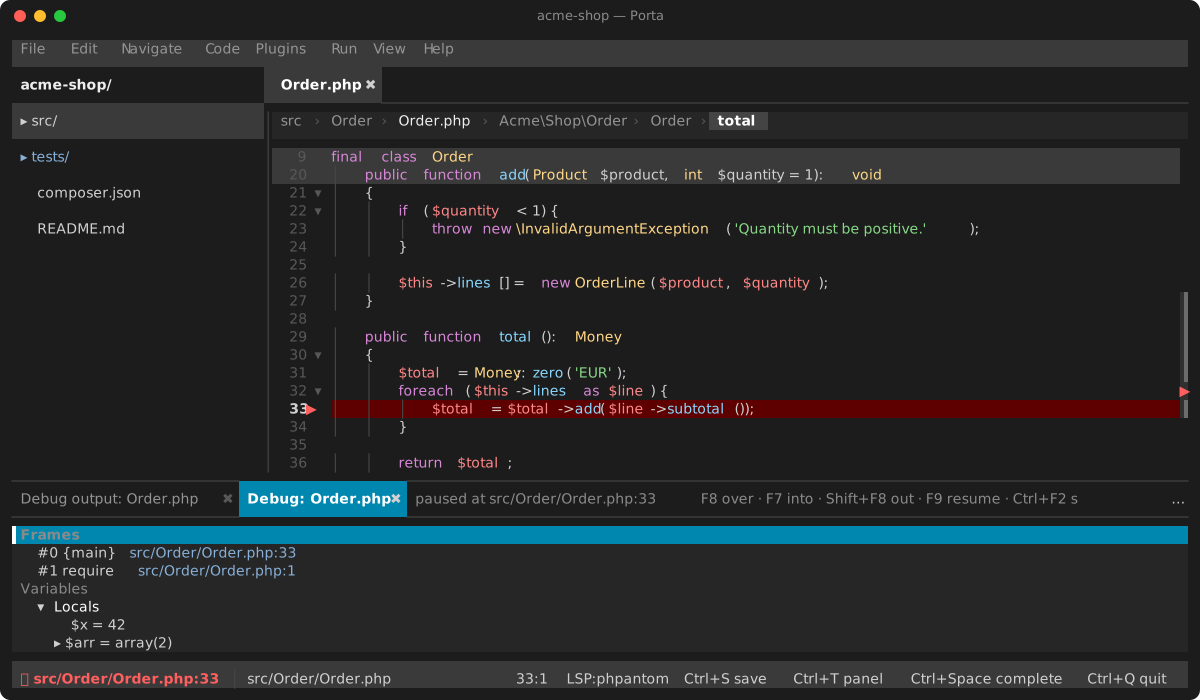
When the program stops, the editor jumps to the stopped line and bands it; the status bar shows ⏸ file:line while paused and ▶ debug while running.
The debug panel
A resizable bottom panel opens with the session:
- Frames — the call stack;
Enteror a click jumps to a frame's source and loads its scopes. - Watches — your watch expressions (
Ctrl+Shift+F9), re-evaluated on every stop and frame switch;Deleteremoves the selected watch, and structured results expand like variables. Evaluation errors render dimmed. - Variables — scopes with lazily-expanded children;
Enter/click expands one level, andeedits the selected variable's value.
Debug: Evaluate Expression in the palette (paused only) evaluates a one-shot expression against the current frame and flashes the result.
The panel header shows the session state and a stepping-key legend. Program output streams into a terminal buffer titled Debug output: <file>, beside the panel's own Debug: <file> tab.
Exception breakpoints & persistence
Debug: Exception Breakpoints (palette, active session only) lists the adapter's exception filters as checkboxes — toggling re-syncs the live session immediately; Escape closes the chooser. Adapters that advertise no filters get a flash instead.
Alt+F9 continues to the caret line via a one-shot breakpoint that disappears on the next stop, whatever stopped you. If the caret line already carries a breakpoint, its condition is respected rather than bypassed.
Breakpoints (with conditions), watch expressions and the exception-filter selection persist per project in .porta/debug.json and restore on the next launch — breakpoints in files that no longer exist are dropped.