
Graph viewer
The diagram engines themselves — native Mermaid, the dot, plantuml and mmdc invocations, SVG/PNG/PDF export and conversion between the three languages — live in janalis/viz; this plugin is the pane, the previews and the event-loop scheduling around them.
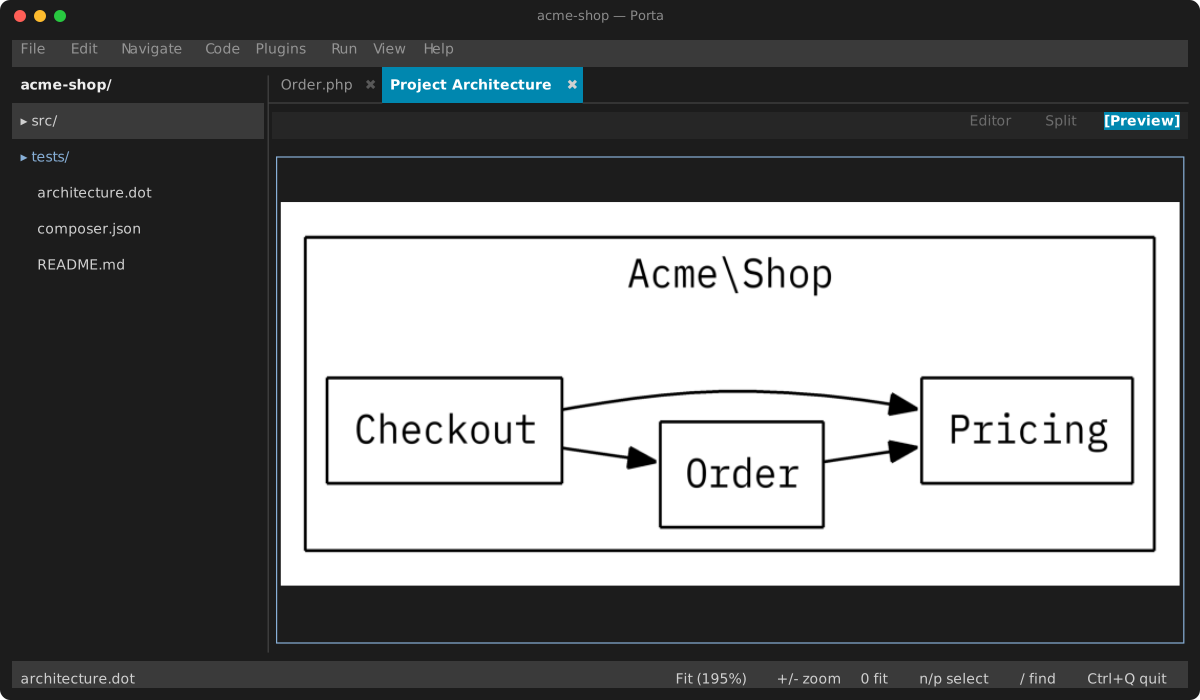
Opening a .dot or .gv file shows its source with the Graphviz graph beside it as a live preview, the picture dot itself draws — real splines, arrowheads, fills and fonts (install graphviz, or point the graph-viewer plugin's dotPath setting at it). Without dot, viz draws the picture itself; the tab is then that picture alone, since the node selection, the counts and the cell rendering all come from dot's layout. The plugin's Settings page lists the three tools it can use — dot, mmdc and plantuml, each optional — with an Install button that runs Homebrew (npm for mmdc when it is there), and Update once Porta manages the copy. Zoom with =/-, 0/f fit, 1 actual size, a click on the status bar's +, - or 0 fit, or Ctrl+wheel at the pointer — including the trackpad's Ctrl+two-finger-scroll, which glides (see the image viewer for why that is as close to a pinch as a terminal gets); pan with the arrows, the wheel, or by dragging; select nodes with n/p or a click, which frames the node and names it in the status bar. A click selects the node the picture shows under the pointer, and nothing over the empty space around it. A terminal that draws pixels outlines the selected node in the picture itself, to the pixel. Zooming in re-renders the graph at a higher resolution rather than magnifying pixels, so labels sharpen as you go.
/ finds a node by name. Two hundred namespaces laid out by dot are not something you can read your way through, so the key opens the ordinary filterable list over every node — type to narrow it — and picking one selects that node and pans to it, exactly as n/p would. Each row carries the node's in/out degree, which is the one thing a list can say and the picture cannot: the hub you are looking for is the row with fifteen edges, and it looks like every other box on screen. Graph: Find Node does the same from the palette.
v toggles the two renderings. Bitmap is what the graph actually looks like — dot's own splines, arrowheads and fonts — and cells draws the node labels as real terminal text, which stays readable at a pane size where the bitmap's type is a few pixels tall. Cells is also what paints when dot cannot produce a bitmap at all (no libgd) or has not answered yet, and the standing preference is the graph-viewer plugin's renderMode setting. A PlantUML picture has no layout to draw from, so it ignores the toggle.
The same tab opens PlantUML documents — .puml, .plantuml, .pu, .iuml and .wsd — rendered by the plantuml tool: set the PlantUML path setting to a launcher or straight to a plantuml.jar (it is run with java -jar), or leave it empty to use plantuml from your PATH. Zoom, pan and the re-render-as-you-zoom all work the same, and a syntax error is reported in the banner instead of being drawn into the picture. What a PlantUML tab does not have is a node model, so n/p, click-select, the node counts and the v cell rendering do nothing there. PlantUML uses Graphviz for several diagram types (class, activity, state), so install dot as well if those come out empty. With no tool installed, viz draws them natively, and what it leaves to PlantUML — an !include of a file or a URL, among others — is refused with the reason in the banner. With Preview PlantUML beside its source off on the graph-viewer plugin's page, these files stay editable text.
Mermaid files (.mmd and .mermaid) open with a live preview when Preview Mermaid beside its source is enabled. Set Mermaid CLI path to a local mmdc executable, or leave it empty to discover mmdc on PATH. The path is read for every render, so setting changes apply without restarting. The picture supports zoom, fit and pan, and keeps the previous successful result on invalid edits. Bitmap mode prefers the local CLI and falls back to native rendering for the families listed below. Native previews support node selection and search; Mermaid documents also support native SVG/PNG/PDF export. CLI pictures expose source selection and search when native semantics can be matched to unambiguous SVG IDs or labels. The installed official CLI browser rasterizes that same SVG, preserving HTML labels and fonts. Other toolchains keep ordinary CLI PNG rendering without a semantic map. Successful SVG snapshots up to 4 MiB are reused during zoom refinement; source and live tool-path changes invalidate them.
Markdown previews also render mermaid, dot/graphviz and plantuml/puml fences inline. Rendering keeps the source visible while pending, and errors retain the last successful picture. PNGs use terminal graphics when available and fitted half-block rows otherwise. At most two blocks render at once. Changing tool paths rerenders the fences; disabling graph-viewer restores ordinary code fences. Mermaid fences with semantic maps expose clickable source-linked node regions, searchable labels and a Find node picker. SVG/PNG/PDF controls export the successful unsaved fence snapshot beside the document as <name>-diagram-<number>.<format>. Pending replacements disable old interactions; delayed picker selections cannot act on replaced results.
v switches to a cell rendering that draws node labels as terminal text — less faithful, but readable when the picture's own type is only a few pixels tall. The Graph rendering setting (Settings ▸ General) picks which one new tabs open with. It is also what you get automatically if your graphviz was built without PNG support, with the reason in the banner.
The graph follows the source as you type. An invalid document keeps the previous graph, and what dot says is wrong shows in the editor like any other error: underlined on the line it names, in the gutter and in Problems. With the preview shown alone, where the editor is out of sight, the first error also tops the picture. A failure of Graphviz itself (answering nonsense), or a document viz cannot draw without it, is the pane's to say, in a banner. The viewer is a bundled plugin, enabled by default — disabling it opens .dot files as plain text with no preview. Plugins ▸ Project Architecture generates a namespace-dependency graph of the current project into architecture.dot and opens it with the graph alone on screen (Ctrl+Alt+V brings its DOT back). The plugin's Architecture output directory setting picks where that file goes — empty means the project root, a relative path resolves from it, an absolute one is taken as given, and the directory is created if it does not exist. (Its Architecture command setting supplies the DOT instead — that command's stdout wins.) Graph: Export SVG/PNG/PDF in the palette renders the active graph — Graphviz, PlantUML or Mermaid — beside its file.
Keys
When a .dot, .gv or PlantUML tab is active. The zoom keys match the image viewer's, but zooming in re-renders the graph at a higher resolution rather than magnifying pixels.
| Key | Action |
|---|---|
= / - | Zoom in / out (also Ctrl+wheel, anchored at the pointer) |
0 / f | Fit to window |
1 | Actual size |
Arrows / Shift+arrows | Pan (also the wheel, or dragging) |
n / p | Select the next / previous node, framing it and naming it in the status bar |
/ | Find a node by name — a filterable list of every node with its in/out degree; picking one selects it and pans to it |
v | Toggle bitmap / cell rendering — the picture dot draws, or node labels as real terminal text, which stays readable when the bitmap's type is a few pixels tall (no effect on a PlantUML picture, which has no layout to draw from) |
Mermaid and Markdown
.mmd and .mermaid documents have live previews. The mermaid setting controls Mermaid support; mermaidPath selects a local mmdc executable, with an empty value discovering it on PATH. Bitmap rendering uses the local Mermaid CLI. Markdown fences accept mermaid, dot, graphviz, plantuml and puml, and retain source or the previous preview when rendering fails.
Cell mode and CLI failures can use native rendering for flowchart, graph, sequenceDiagram, pie, journey, timeline, mindmap, quadrantChart, xychart/xychart-beta, packet/packet-beta, kanban, sankey/sankey-beta, treemap/treemap-beta, treeView-beta, ishikawa/ishikawa-beta, radar-beta, cynefin-beta, requirementDiagram, info, erDiagram, classDiagram/classDiagram-v2, stateDiagram/stateDiagram-v2, gitGraph, wardley-beta, block/block-beta, swimlane-beta, agentflow-beta, gantt and all five C4 headers. With GD/FreeType, bitmap fallbacks and PNG exports draw the native scene; SVG export needs no graphics extension. Classic flowchart shapes retain their outlines in native pictures. Native pictures follow Mermaid's theme, look and themeVariables for every family, with the 12.1 defaults: flowchart, sequence, class, state, ER, requirement, use case, Venn, swimlane and agentflow draw redux-color in the neo look. look: handDrawn sketches the families that upstream sketches, with roughjs strokes and hachure fills reproducible from handDrawnSeed, while terminal cells stay classic. Markdown string labels draw bold, italic and wrapped runs, and PNG text falls back to host fonts for glyphs the bundled face lacks. Every pinned configuration option is accepted and checked; the compatibility ledger lists those that change the native picture. Native rendering preserves labels and relationships in a terminal scene and includes a statement legend in inline previews. Invalid edits keep the last successful result. Nested subgraphs preserve local directions, declaration order and links to their frames. A node link crossing a group boundary makes that group inherit its parent direction, following Mermaid semantics. Repeated nodes stay in the first subgraph that closes around them. Repeated subgraph ids merge their members and retain the first closed declaration's title and direction. Extended link operators reserve additional ranks; circular, cross and reverse endpoints retain their glyphs in native exports. CSS includes standard color names, background color aliases, bold/italic faces and bounded font sizes. SVG/PNG text scales with its cards and headers; cell text keeps the terminal font.
Native swimlanes use the shared flowchart syntax with global ranks across parallel lanes. They support horizontal/vertical directions, nested tracks, group dependencies, styles and source-linked headers. Loose steps receive an anonymous lane. Root lanes retain declaration order.
Native block diagrams preserve authored nested grids, column spans, empty slots, classic shapes, directional block arrows, typed endpoints and CSS/classes. Cards and composite headers retain source navigation. Native C4 diagrams support context, container, component, dynamic and deployment views, named macro arguments, nested boundaries, relationship style updates and source-linked cards. Deployment frames use perspective strokes; dynamic relationships retain numbered captions. Cards set their names bold at the configured per-type font sizes and weights, $shape takes any flowchart shape, and $sprite reserves its pinned space.
Native Wardley maps preserve authored visibility/evolution coordinates, value-chain dependencies, pipelines, sourcing/inertia symbols, evolution arrows, custom stages, notes and annotations. Components and annotations retain source navigation; anchors use bold labels. Negative label offsets extend the exported canvas.
The native Git-graph renderer preserves branch history, merge parents, cherry-picks, commit types, messages and tags in LR, TB and BT layouts. Pictures label commits with their ids, slanted as pinned, fly tags as flags and route arrows with pinned rounded turns. Branch and commit elements retain source navigation. Supported configuration includes main-branch naming/order, branch/commit-label visibility and parallel commits. Generated ids are deterministic.
The native state renderer supports composite states, concurrent regions, local directions, start/end markers, choices, forks/joins, descriptions and side notes. State cards and composite headers retain source navigation. Shared CSS supports bold/italic text and border declarations in native SVG and PNG output.
The native class renderer supports labeled/generic classes, attribute and method compartments, annotations, nested/dotted namespaces, relationship multiplicities, UML endpoint glyphs and bounded CSS. Classes and member legends retain source locations. Pictures follow the pinned card: the first annotation in guillemets over the bold name, members left-aligned as ClassMember displays them (~T~ generics as <T>, : before return types), static members underlined and abstract ones in italics. Notes draw as note boxes, dotted to their class. Links and callbacks stay descriptive.
The native sequenceDiagram renderer supports ordered participants and actors, aliases, implicit participants, messages, self-messages, notes, line breaks, entity escapes and autonumber start/increment/off/resume. Native autonumber starts and increments are bounded to 1,000,000,000,000.99; hundredths remain exact when incremented. Dotted lines and message direction remain visible, and native pictures draw each pinned endpoint: arrowheads, crosses, open-arrow chevrons, half-arrows and central dots. Inline statement legends retain the exact arrow tokens. Nested loop, opt, alt/else, par/and, par_over, critical/option, break and rect blocks use labeled frames. Explicit and shortcut activations stack per participant; open activations extend to the diagram end. Titles and accessibility titles/descriptions appear above the participant columns. Creation and destruction directives anchor headers and lifeline endpoints to their associated message; destruction also clips open activation bars. Duplicate creation, unmatched lifecycle directives and malformed accessibility blocks produce located errors. YAML and JSON participant configurations (type and alias) and participant-only box … end groups render natively. External aliases take precedence. Pictures draw each participant type's pinned glyph (actor, boundary, control, entity, database, collections, queue), and the readable legend records the type. Participants repeat beneath the timeline unless mirrorActors is false. Group labels retain their color descriptions while frames use the terminal theme.
Native participant menus support link, JSON links, JSON properties and details. Links and property values appear in panels below the chronology and in the readable inline legend. Repeated keys replace earlier values without moving their order. Details retain their document-element reference; terminal previews have no browser DOM from which to resolve its contents. Use Mermaid entity escapes for literal separators in simple links.
The native pie renderer preserves slice order, numeric values, showData, titles and accessibility descriptions. Native pictures use ordered circular wedges or donuts; cell previews retain readable labels, percentages and exact source values. pie.donutHole, textPosition and all five legendPosition values are supported. Slices below 1% remain in the legend while visible wedges fill the circle, matching the pinned renderer. Zero-valued slices retain their labels; repeated labels retain the first value, matching the pinned parser. Nonnegative finite values and a finite total are required. Control characters in labels appear as readable escape names. YAML front matter titles and configuration render natively.
Native families accept leading YAML front matter with a string title. Titles appear above the diagram and in inline legends without entering node selection. Body titles take precedence. The source line of every original node is preserved, including in indented/CRLF documents. Info keeps its upstream behavior of ignoring title metadata. Unknown metadata keys are ignored. Supported config values are described below; displayMode: compact sets gantt's compact mode.
Native configuration accepts sequence.showSequenceNumbers (boolean) and pie.highlightSlice (a slice label), in YAML front matter or leading %%{init: {…}}%% / %%{initialize: {…}}%% directives. Later directives override front matter and earlier directives; explicit false survives the merge. Configured sequence numbering stays visible across autonumber off, matching upstream; body start/increment declarations still set the counter. A matching pie slice uses an amber card/bar and a * marker while preserving its value, order and source navigation. Hover effects are browser interaction (see Non-goals). As pinned, unknown options are ignored; wrong value kinds and configuration for a different diagram family report located errors. Empty maps are accepted. As pinned, directives apply wherever they stand, including %%{wrap}%%.
The native journey renderer draws the pinned picture: the sorted actor legend, each section's header over its task columns, actor dots on every task, the timeline arrow and a smiling, level or frowning face at each task's score. It preserves repeated and empty sections, task scores from 1 to 5, actor order and membership, titles and accessibility descriptions; titleFontSize and taskFontSize size the text. Actor lists distinguish omitted actors from explicitly empty entries; tasks and inline legends retain source origins.
Participant YAML accepts flow maps, multiline block maps, quoted/plain strings, comments and literal/folded text. Dates retain their exact text. False-value aliases fall back to the participant ID; quote numeric/boolean spellings to keep them visible. Declaration-local scalar anchors and bounded collection references are supported, including cycles inside ignored metadata. Unknown fields and literal << keys are ignored. Document/tag directives use the pinned JSON schema. Alias keys (including flat arrays), plain flow keys and scalar list mapping pairs retain their resolved keys; duplicate keys remain errors even after null values and in JSON metadata. Unsupported custom tags, malformed fields and exceeded resource limits produce located errors. The compatibility document lists the remaining native syntax and graphics gaps.
The native timeline renderer supports the default LR direction and explicit LR/TD, ordered periods, stacked events on the same or following lines, repeated and empty sections, titles and accessibility metadata. Events preserve URLs and literal colon punctuation; only colon followed by whitespace starts a new event. Periods follow the timeline axis, with event chains perpendicular to it. Native selection/search covers semantic elements and excludes metadata decorations. Exports include unsaved edits without saving the document.
See the compatibility checklist for each family's limits and the non-goals. Every pinned upstream end-to-end diagram renders natively; what a terminal-native renderer leaves to the browser, such as exact browser geometry, KaTeX math, HTML labels and remote images, renders through the Mermaid CLI. How each family was brought up and verified is in the compatibility history.
In a project you have not trusted, the Mermaid CLI's browser is kept off the network: a diagram's remote images are not fetched, so opening one tells no one that you did. Everything else about it renders the same. See Trusting a project.
The native mindmap renderer follows indentation, including uneven indentation and repeated labels on separate branches. It supports quoted multiline labels, entity escapes, node shape declarations, source navigation, selection, search, and SVG/PNG export. Pictures retain square, rounded, circular, hexagonal, cloud, bang and plain node outlines in section colors. Branches grow either side of the root; the pinned force layout's exact geometry needs the CLI. Icons and classes draw nothing, as in the pinned renderer.
The native quadrantChart renderer places points at their authored coordinates between zero and one, with Y increasing upward. It supports axis/quadrant labels, titles and accessibility descriptions, quoted labels, and point radius, color, stroke-color and stroke-width styles. classDef declarations can follow their points; inline styles override individual class properties. Points support selection, search, source navigation and SVG/PNG export. The native picture paints the theme's quadrant fills and horizontal Y-axis labels. Pictures turn the Y-axis captions as pinned; label collision avoidance is browser geometry, a non-goal.
The native xychart/xychart-beta renderer supports vertical and horizontal line/bar charts, category and numeric axes, explicit ranges, named series, point labels and accessibility metadata. Bars begin at the first endpoint of the value range and overlap across series. Individual values support selection, search and source navigation, including line points over bars. Native output uses fixed colors, point markers and horizontal axis captions. See the compatibility checklist for remaining differences.
The native packet/packet-beta renderer draws proportional fields in ascending 32-bit rows. It supports single bits, inclusive ranges, automatic +count fields, single/double quoted labels, titles and accessibility metadata. Fields must be contiguous starting at zero. Fields crossing row boundaries split into selectable fragments that follow the original declaration. Labels wrap within their fields; pictures shorten labels beyond 256 characters and selection summaries beyond 240 columns. Native work is limited to 4,096 fragments and 131,072 bits. Configuration options, including descending order, custom row width and hidden bit labels, render natively.
The native kanban renderer uses the first declaration's indentation for column headers. All deeper declarations become cards in the latest column, including extra indentation levels. Repeated ids remain separate occurrences. Cards wrap within equal-width columns and retain source navigation, search and exports. @{...} metadata supports quoted/unquoted scalars, flow lists, comma-separated or multiline mappings, and label overrides. Pictures draw cards as pinned: Markdown titles, ticket and assignee beneath them and a priority bar; cells keep every field as inert text. Icons draw nothing, as pinned. Class names style nothing, as their CSS belongs to the host page. A board is limited to 4,096 declarations.
The native sankey/sankey-beta renderer accepts three-column CSV records (source, target, value), quoted commas/newlines, doubled quotes, blank lines and standalone %% comments. It retains duplicate flows, merges nodes by their trimmed names, and requires finite non-negative decimal or exponent values. Cycles are rejected before layout. Native SVG/PNG uses proportional filled ribbons and justified terminal nodes, with fixed colors and label padding. Cells retain centerlines and a flow legend. Nodes support selection, search and navigation to their first source occurrence. Layout follows deterministic source order rather than D3's iterative optimization; gradient links blend source into target. Sources are limited to 4,096 nodes, 4,096 flows and 65,536 bytes per CSV record.
The native treemap/treemap-beta renderer accepts indented quoted sections, valued leaves, multiple roots, metadata, :::class assignments and forward classDef declarations. SVG/PNG renders proportional nested tiles, section headers, values, fill/stroke/text colors, border widths and dashed borders. Labels wrap and clip inside tiles; selection, search and the legend retain full labels and values. Text contrast is chosen automatically unless a class sets it. Cell mode approximates the diagram with the shared box renderer.
Weights are normalized before summing descendants. Zero-valued siblings occupy no area beside positive values; an all-zero sibling group shares its area equally. Layout uses deterministic binary tiling in source order rather than D3's sorted squarification. Numeric values must be complete finite non-negative decimals; thousands commas are accepted, while malformed numeric prefixes are rejected. Limits are 4,096 nodes/classes, 128 section levels and 65,536 bytes per statement. Class styles accept opacities, alpha colors and authored dash lengths; other CSS is rejected.
The native treeView-beta renderer accepts indented bare/quoted labels, multiple roots, multiline quoted labels, metadata, and standard/heavy Unicode box-drawing input (├──, └──, ┣━━, ┗━━). Branch columns determine depth; tabs in box-drawing prefixes expand to four spaces. Original source lines remain available for selection, search and source following. SVG/PNG uses an outline with elbow connectors, wrapped rows and a visible :::highlight background. Consecutive spaces, Unicode and trailing directory slashes are preserved.
Trees hang from the pinned bold / root; directories draw bold and ## descriptions follow in italics. icon(name) draws the built-in folder or file glyph, or the pinned unknown-icon tile; icon()/icon(none) hides it, and showIcons adds the defaults. Other class annotations remain in the legend; as pinned, they only name host-page CSS. Mixed indented and box-drawing child syntax is rejected. Limits are 4,096 nodes, 128 levels and 65,536 bytes per statement.
The native ishikawa/ishikawa-beta renderer treats the first label as the effect and subsequent indented lines as causes and subcauses. Cause indentation is relative to the first cause, independently of the effect's indentation. Standalone %% comment lines are ignored; quotes, separators, metadata words and inline comment markers within labels remain text. Labels support the shared entity and <br> decoding.
SVG/PNG draws a right-facing effect head, horizontal spine, alternating cause pairs and nested horizontal/diagonal bones with arrows toward their parents. Wrapped labels, repeated occurrences, selection, search and source following work without the CLI. Native spacing follows measured label heights and source order; exact upstream placement is browser geometry, a non-goal. Limits are 4,096 nodes including the effect, 128 hierarchy levels including the effect and 65,536 bytes per label. An effect label is required.
The native radar-beta renderer accepts an optional header colon, named axes, quoted labels, multiple curves per declaration, ordered values or named axis references (with an optional colon), multiline curve bodies, metadata and comments. Forward references resolve after parsing. Options include showLegend, ticks, min, max and circular/polygon graticule grids. SVG/PNG uses a fixed palette, outlined curves, point markers and an optional graphic legend. Circular curves use sampled closed splines; polygon curves join their points directly.
Data points support selection, search and source following. Cell legends retain full values even when the graphic legend is hidden. Numeric values must be complete finite non-negative decimals. Values clip to the shared radial range; a flat range places all points at the center. Incomplete curves and unknown or duplicate axis ids report errors rather than disappearing. Repeated references use their first value. Limits are 256 axes, 4,096 points/curves and 65,536 bytes per declaration; integer tick counts clamp to 32. Axis captions shorten long labels for graphics while full labels remain in semantic summaries. Curves fill at the pinned curveOpacity in the theme's cScale colors; exact SVG geometry is a non-goal.
The native cynefin-beta renderer accepts the optional header colon, the five named domains, single/double-quoted items, multiline and escaped labels, metadata, comments and labeled domain transitions. Repeating a domain block replaces its previous items, including replacement with an empty block. Self-loop transitions are ignored. Items after metadata or a transition require a new domain declaration.
Native graphics place Complex/Complicated above Chaotic/Clear, with Confusion in a central ellipse. Regions grow to keep every item visible, including all Confusion items. Headers and items support selection, search and source following; transition captions remain in the source-linked legend. Exterior transition lanes keep arrows and labels out of domain contents. Quadrants meet in one field with the pinned seeded dashed folds and red cliff; cynefin.seed and boundaryAmplitude shape them. Limits are 4,096 authored items, domain blocks and transitions each, plus 65,536 bytes per declaration; replaced items and dropped self-loops still count toward limits.
Native requirementDiagram support includes the six requirement types, elements, standard fields, seven relationship kinds, reverse arrows and all four directions. Cards wrap their full fields and support search, selection and source following. Node classes and styles support colors, stroke width and dash presence, including forward assignments. Metadata and relationships remain in the source-linked inline legend. Cards draw the pinned type header, bold name, divider and left-aligned fields, and edges the SysML circled plus and open arrowheads; exact geometry still needs the CLI. See the compatibility checklist for syntax and style limits.
Native info and info showInfo diagrams display Porta's native renderer name and its pinned Mermaid compatibility target. This identifies the native implementation; it does not report an installed MermaidJS runtime. The common title and accessibility declarations are validated but, as in the pinned upstream info renderer, do not change the graphic. The diagnostic supports selection, source following and SVG/PNG export. Title-only front matter is accepted and ignored. Upstream version styling is browser typography, a non-goal.
Native erDiagram support includes named/quoted entities, first aliases, ordered attributes, nullable/custom types, PK/FK/UK keys and quoted comments. Relationships create their endpoint entities and retain cardinalities and role labels. Identifying links are solid; non-identifying links are dashed. All four layout directions, cycles, repeated attribute blocks, selection, search, source following and SVG/PNG export work natively. Cards wrap their fields; relationship captions use plain backgrounds and separate baselines for wrapped text. Graphics add mandatory bars, optional circles, crow's-foot branches and MD-parent diamonds while retaining numeric cardinality captions. Header and attribute rows have separate compartments, including wrapped fields. Self-relations route outside the card with their captions underneath; glyphs do not add selectable entities. ER node styles accept style, classDef, class and inline ::: assignments on entities and relationship endpoints. The supported CSS subset covers fill, stroke, text color, stroke width, dash lengths and transparency; styles also apply to table rules. Forward classes resolve after parsing, with inline node styles overriding classes. Cards draw the pinned attribute table, its columns aligned, and subgraph … end frames entities. See the compatibility checklist for limits.
Native flowcharts draw all 53 registered ordinary shape kinds and their 150 unique names/aliases, including documents/stacks, storage symbols, windows, persons, braces and label-free primitives. Their silhouettes also govern hit testing and edge intersections. Edges follow flowchart.curve, linkStyle … interpolate and edge-ID curve metadata, defaulting to Mermaid's basis splines. Edges that span several ranks reserve a lane beside the intermediate cards instead of crossing them. @{ icon } nodes draw the pinned unknown-icon tile, since no icon pack is registered, and @{ img } nodes embed data: pictures; other image sources draw a placeholder, because native rendering never fetches. Math (KaTeX) is a non-goal.
Native syntax work is pinned to Mermaid 12.1.0, commit 21f72f07ea22c0af48a3149c550654e80d8e40cb, using its documented syntax and parser grammars as the compatibility reference. Mermaid supports zoom, pan and fit controls. Node selection and search also work in native Mermaid previews; use cell mode when viewing a CLI-rendered picture to reach the native node model.
Native usecase-beta diagrams support actor variants, use cases, package/system boundaries, UML relationships, source-ordered JSON tables, notes, metadata and classes/styles. Native cells retain source selection; SVG/PNG use actor glyphs, business slashes, package tabs and table compartments. Font size/weight and spacing configuration are supported. Unregistered icons draw the pinned unknown-icon tile; backtick labels draw their Markdown runs; see the compatibility ledger.
Native railroad previews accept primitive, EBNF, ABNF and PEG headers. They draw terminal/nonterminal boxes, alternatives, optional bypasses and repetition return tracks, retaining source selection for rule headings and operands. Finite counts use annotations. Exact upstream layout is browser geometry, a non-goal.
Native venn-beta diagrams draw area-proportional translucent circles, overlap labels and text, with clipped custom overlap fills and source-linked captions. Pair distances approximate higher-order overlaps. CSS beyond the shared subset is a non-goal.
Native architecture-beta diagrams support nested groups, services, junctions, side ports, group traversal, edge labels/arrows, row/column alignment and seeded configuration. Five built-in resource glyphs and text/missing icons export to SVG/PNG; services, junctions and group headers retain source navigation. Native layout uses a terminal constraint grid. The fcose force solver is a non-goal; other icons draw the pinned unknown-icon tile, since the pinned build registers no pack.
Native eventmodeling diagrams support time/reset frames, role aliases, qualified entities, inferred and explicit inputs, data examples/references, notes and criteria. Colored cards occupy chronological role lanes; data compartments, source navigation and SVG/PNG export are native. Long comment streams remain cancellable. Browser typography of embedded data is a non-goal; notes and criteria are readable metadata.