
Xdebug
Debugs PHP with Xdebug, set up in one step. Bundled with Porta and off by default — turn it on under Settings → Plugins → xdebug.
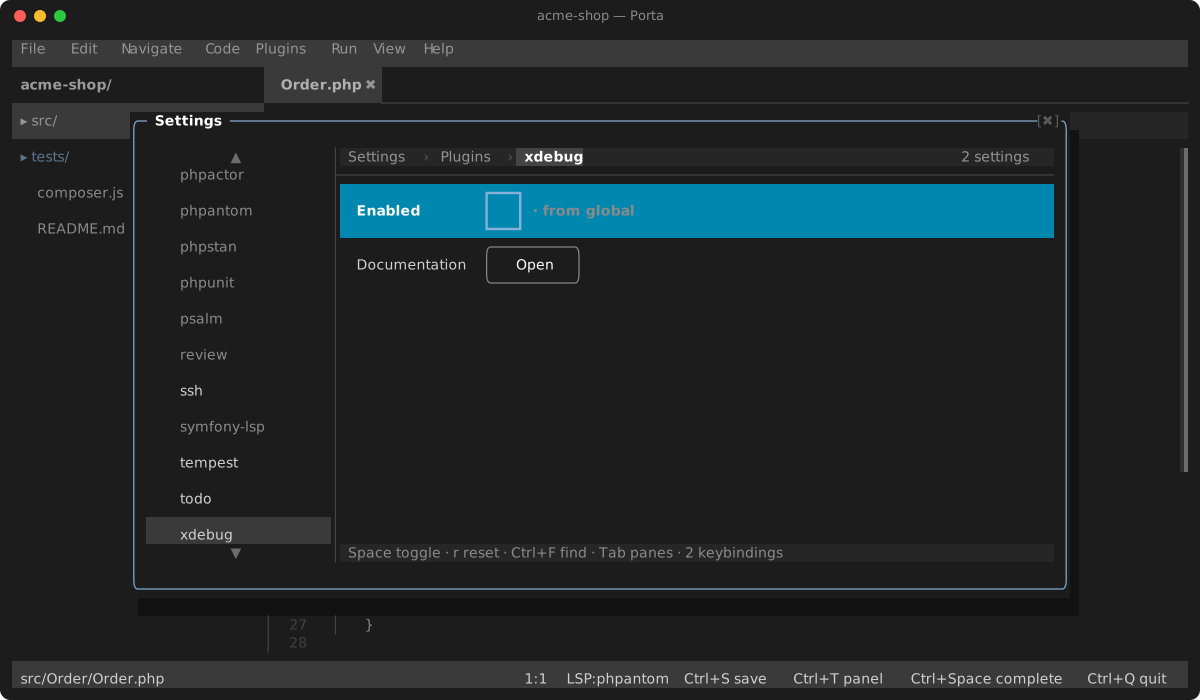
Porta's debugger speaks the Debug Adapter Protocol, and for PHP the adapter is vscode-php-debug, which runs with Node.js. This plugin supplies it, so Shift+F9 debugs the PHP file in front with nothing to configure — see the debugger for breakpoints, stepping and the debug panel. Your PHP needs the Xdebug extension; the adapter starts PHP with Xdebug's debug mode switched on for that run.
The adapter is looked for in this order:
- the php-debug adapter script setting, when you set one;
- the copy this plugin installed;
- the php-debug extension VS Code, VS Code Insiders, Cursor, VSCodium or Windsurf already installed — the newest of them.
While none is found, the plugin's Settings page offers Install: it downloads php-debug 1.40.2 from its GitHub release and keeps it under ~/.porta/tools/php-debug. That release publishes no checksum, so the plugin carries one: a download whose SHA-256 is not the release's is thrown away. A newer adapter arrives with a newer Porta. The button stays once something is found — pressing it again installs the pinned release over the plugin's own copy, which is how to repair it.
An adapter you name in .porta.json under languages.php.debug still wins over this plugin's.
Listening for a web request
Xdebug: Start Listening for Connections (Plugins menu, command palette) starts the adapter without running anything: it waits on Xdebug's port, 9003, for PHP to connect. Load a page in the browser, run a script from your own shell, or start a queue worker, with Xdebug in debug mode and told to start — xdebug.start_with_request=yes, or a browser extension that sets XDEBUG_SESSION — and the request stops at your breakpoints as a Shift+F9 run would. Every request that connects is debugged, one after another, until Ctrl+F2 stops listening.
What you set in the launch config under languages.php.debug.launch applies here too, but for what would run a file (program, runtimeExecutable, runtimeArgs): port to listen elsewhere, and pathMappings when PHP runs in a container and sees your files under another path —
{
    "languages": {
        "php": {
            "debug": {
                "launch": {"pathMappings": {"/var/www/html": "${workspaceRoot}"}}
            }
        }
    }
}
Settings
| Setting | Default | What it does |
|---|---|---|
| php-debug adapter script | empty | The adapter's phpDebug.js; empty finds it as above |
| node binary | node | What runs the adapter |
Both name a program the debugger runs, so a project you have not trusted cannot set them in its own .porta.json: only your own configuration can.